
Is Basketball A Weakest Link Sport?
I recently finished The Numbers Game: Why Everything You Know About Soccer Is Wrong by Chris Anderson and David Sally, the book describes recent innovations in soccer analytics. In it Anderson and Sally talk about how they believe soccer is on the verge of its "Moneyball" moment, as more and more clubs are employing analysts to run the numbers trying to find that extra edge on the competition just as Bill James did for the Oakland A's over a decade ago.
One of the most intriguing takeaways I found in The Numbers Game was a chapter where the authors described soccer as a "weakest link sport". They go on to say :
"If you want to build a team for success, you need to look less at your strongest links and more at your weakest ones. It is there that a teams destiny is determined, whether it will go down in history or be forevrer considered a failure."
In the same chapter they made another point I found compelling. "Soccer is vastly different from basketball, the most superstar driven sport". I thought this topic would be interesting to explore so I set out looking for some data.

After acquiring some data from ESPN and basketball-reference.com I started putting it together and got to work.
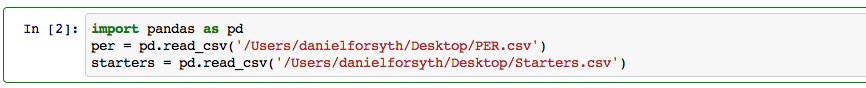
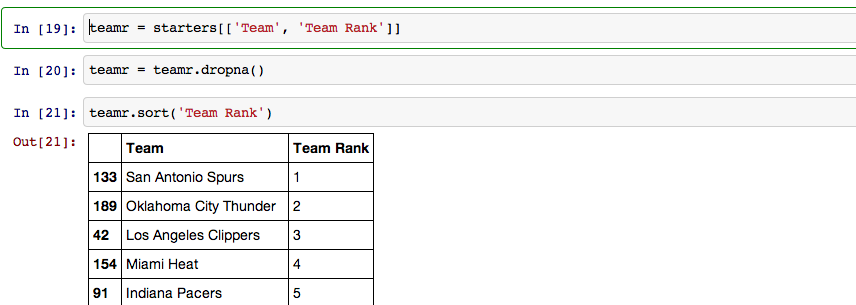
The first thing I did was import Pandas and two csv's I had downloaded. One was all of the starters from every NBA team and their respective team rank. The other included every NBA players player efficiency rating(PER), a stat that combines everything a player does on the court into one number.
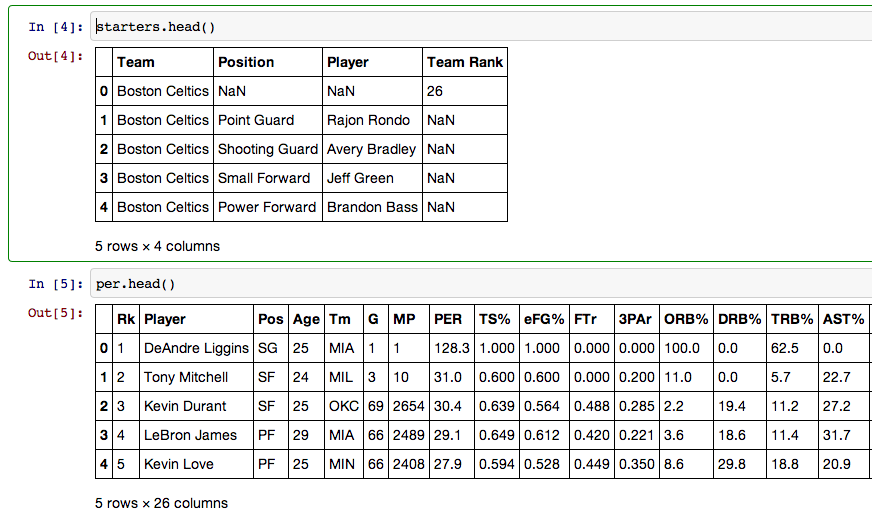
Next I tested to make sure everything was imported properly using pandas built in head method.
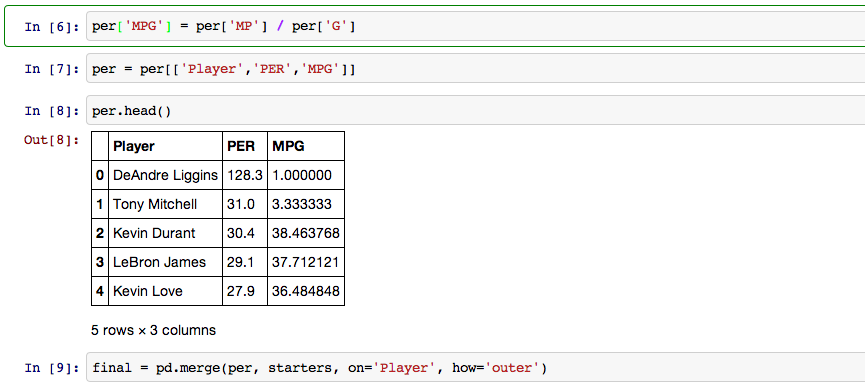
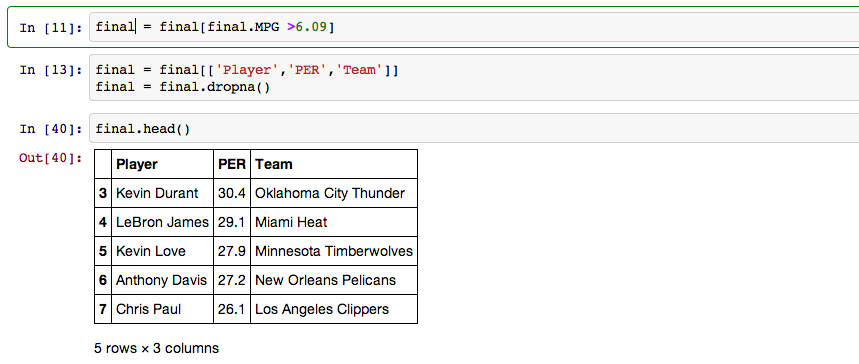
Players must play 6.09 minutes per game to be eligible for a PER rating so next I eliminated all players whose MPG fell under 6.09 minutes and then combined the starters dataframe with the PER dataframe so all of the data I was interested in was together.
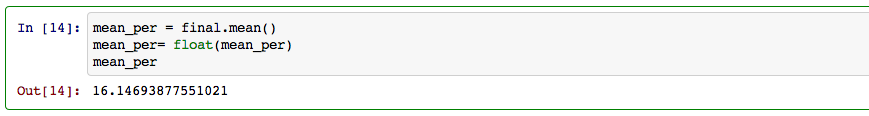
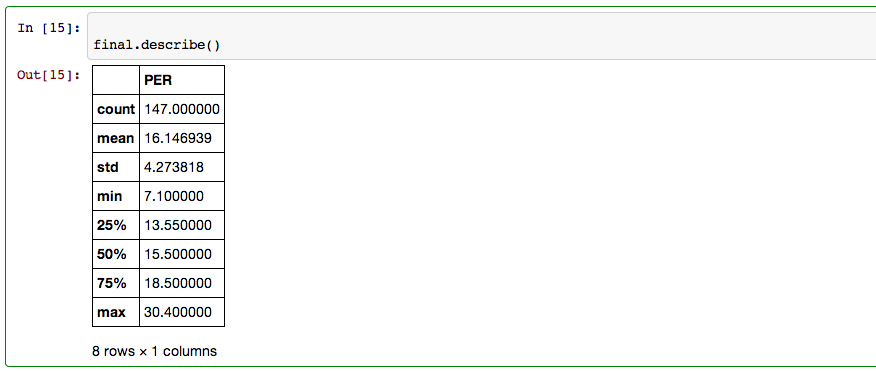
I needed a number to compare the weakest players on each team to so I found the mean PER of all starters.
As well as some other statistics on starters PER.
Next I created a new dataframe that included a column of the difference between the mean PER and the PER of the weakest player on each teams starting five.
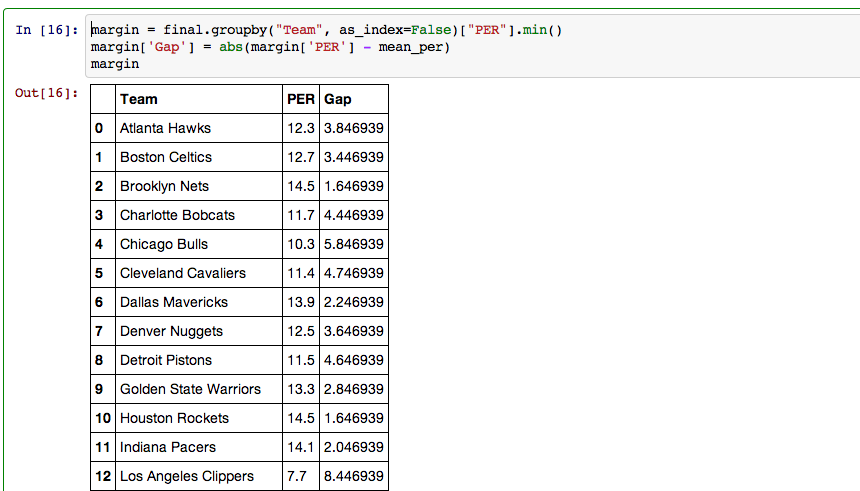
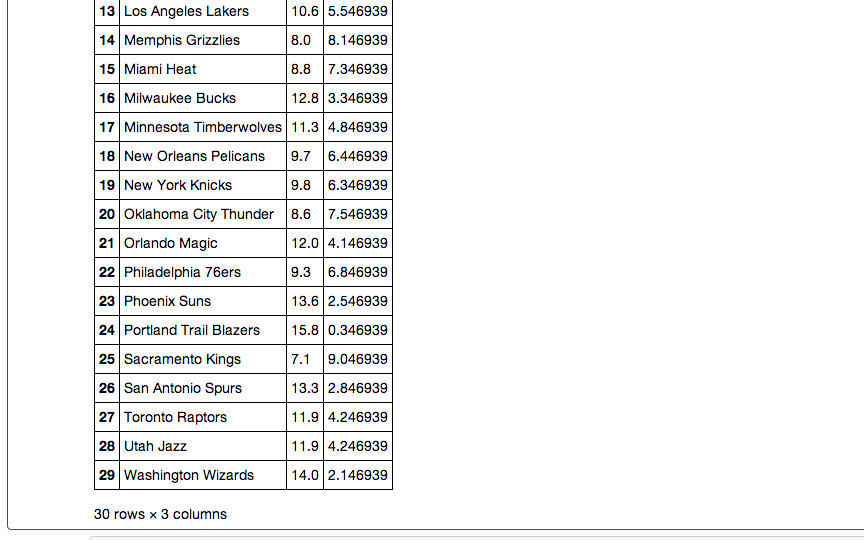
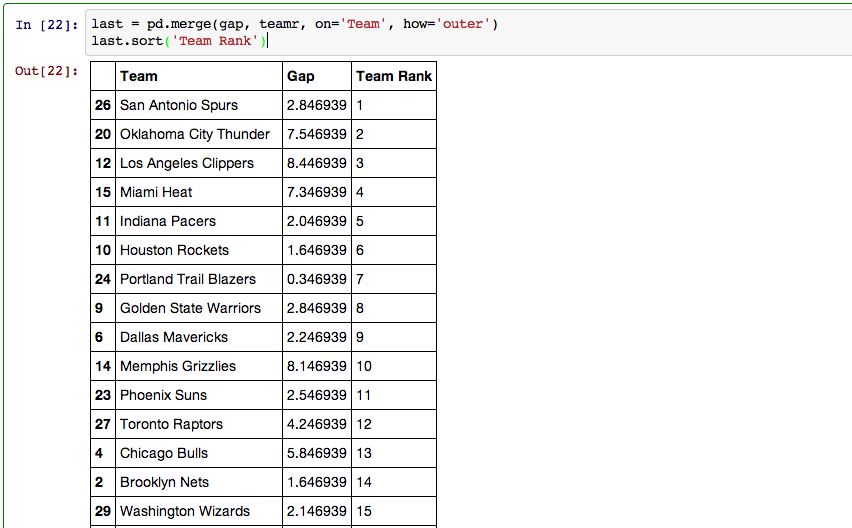
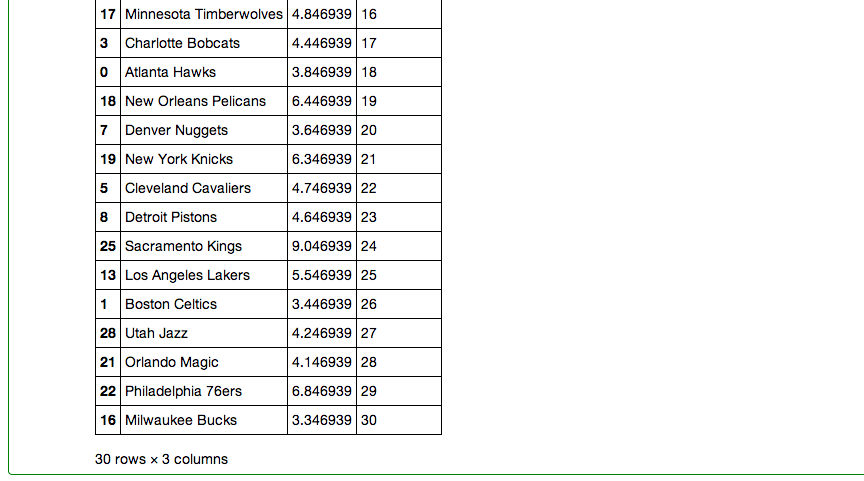
My last step in pandas involved creating a dataframe that included every team, their rank, and their PER gap.
Now that I had all of my data formatted properly it was time to starts visualizing it.
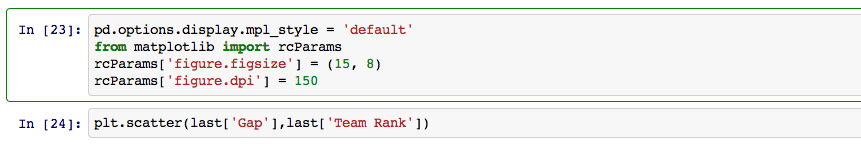
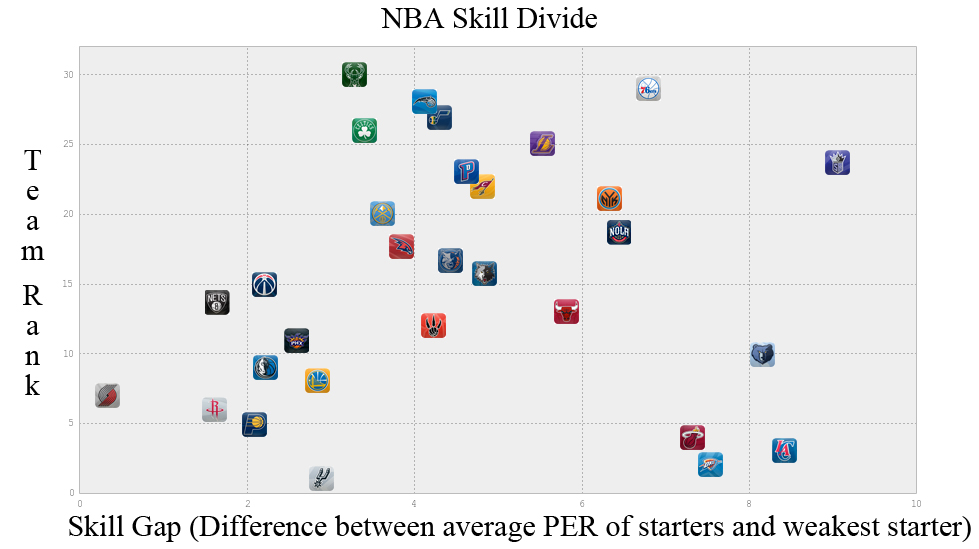
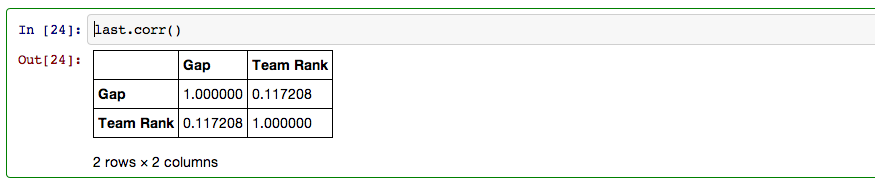
As you can see there is a, albeit weak, correlation between the skill gap and team rank with some strong outliers. The four most prominent outliers are the Miami Heat, Oklahoma City Thunder, LA Clippers, Memphis Grizzlies and Sacremento Kings. These outliers can be explained pretty easily. The Thunder have Kevin Durant, rated first overall in PER with a score of 30.17 (Michael Jordans career PER was 27.91), as well as Russel Westbrook who comes in eighth for PER. The Miami Heat, of course, have the big three of Lebron James, Dwayne Wade, and Chris Bosh. Los Angelos has Chris Paul and Blake Griffin, both in the top ten for PER and excellent compliments to each other. Sacremento has Demarcaus Cousins ranked 5th in PER and the Grizzlies while not having a starter in the top 25 for PER have Zach Randolph and Marc Gasol two very imposing big men.
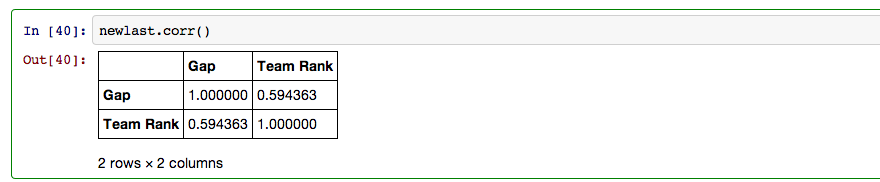
Once the outliers are removed the r value rises from a weak .117 to a substantially higher .594.
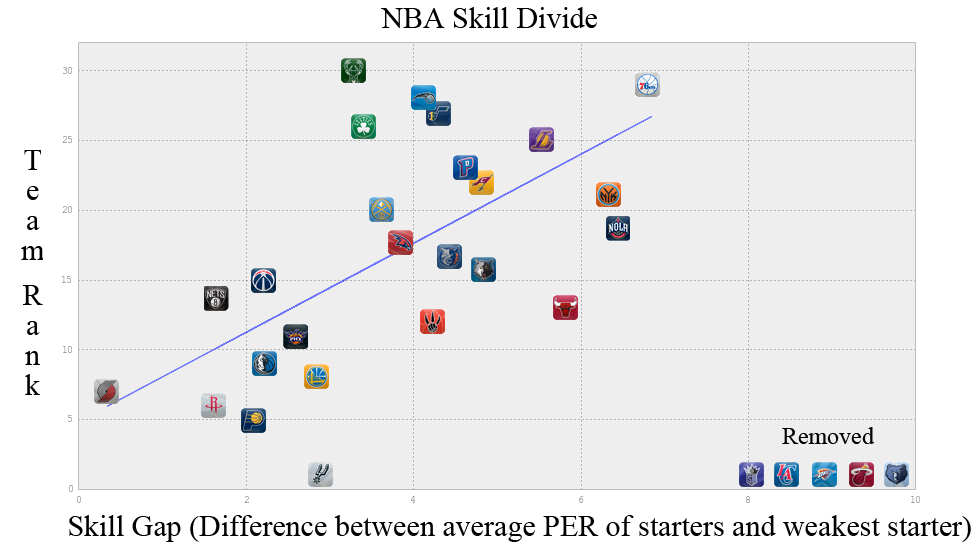
You can see that Anderson and Sally were right, having a top player in the NBA is extremely important, especially when you have a weak starter. Having one, or two, heavy hitters can easily make up for having a large divide between the average NBA starter and the worst player on your starting five. I have only scraped the surface here and in the end Ithink I may have raised more questions than I have answered but it was a good learning experience and brought out some interesting points.
If you have any questions, feedback, advice, or corrections please get in touch on Twitter or email me at danforsyth1@gmail.com.