What If NCAA Basketball Players Were Paid? - An Analysis
Every year around this time, after the conclusion of the collegiate football season and the height of March Madness the question I always hear posed is, should NCAA athletes be paid? This got me thinking, if student athletes were to be paid how much would they be worth? Since we are in the middle of the annual NCAA basketball tournament I chose to work with basketball data in an attempt to answer this question.

My first order of business was to find a statistic that expresses a players overall contributions, A tell all stat that pools everything a player does on the court into one number. After some reading I came across the Player Efficency Rating or PER, which is exactly what I was looking for. Developed by John Hollinger, current Vice President of basketball operations for the Memphis Grizzlies, the player efficeny rating measures a players per-minute performance on the court adjusted for pace. PER takes into account both positive and negative contributions by the player, it is than adjusted to a per-minute basis so that every player, whether it be a starter or a sixth-man, can be compared equally. At this point my game plan become to find current NBA data that included PER and Salary, create a predictive model using this data, then feed it in current NCAA PER stayts to predi players salary.
After downloading some data from basketball-reference.com I opened up ipython and began looking at the data.

I was only interested in the Player Name and current year salary.
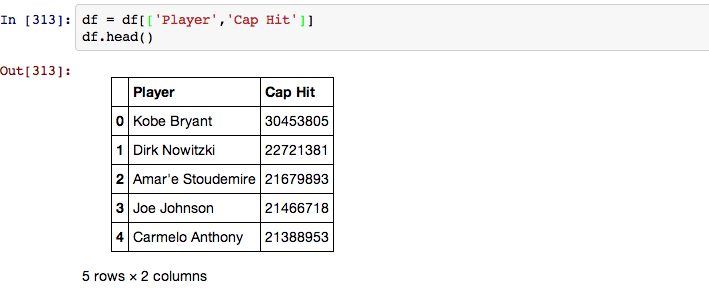
Load Data that includes player efficency rating.

Add a column for minutes per game, to qualify for PER you must have a minimum of 6.09 MPG.
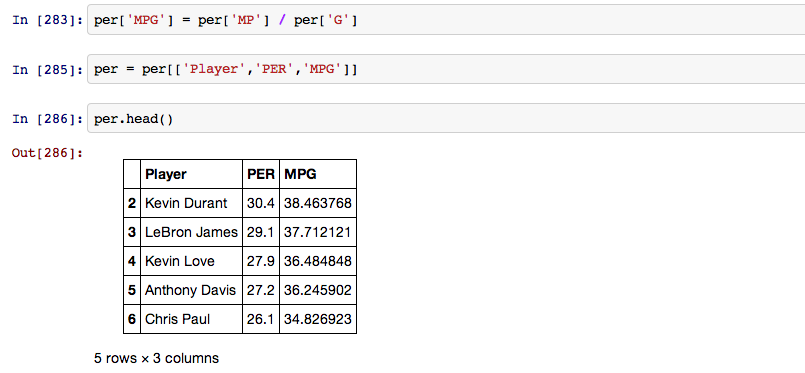
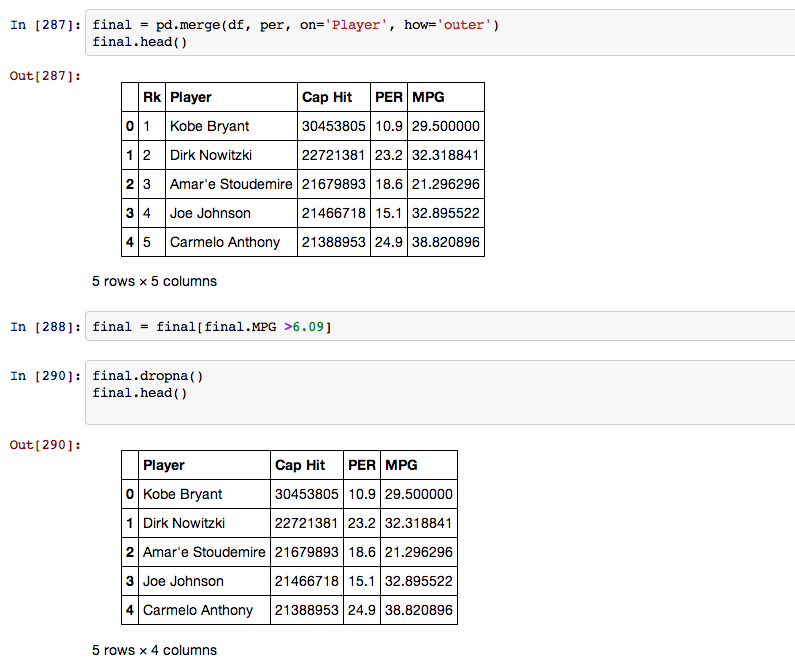
Merge PER and salary data into one table, then display only qualified players and remove and duplicate entries.
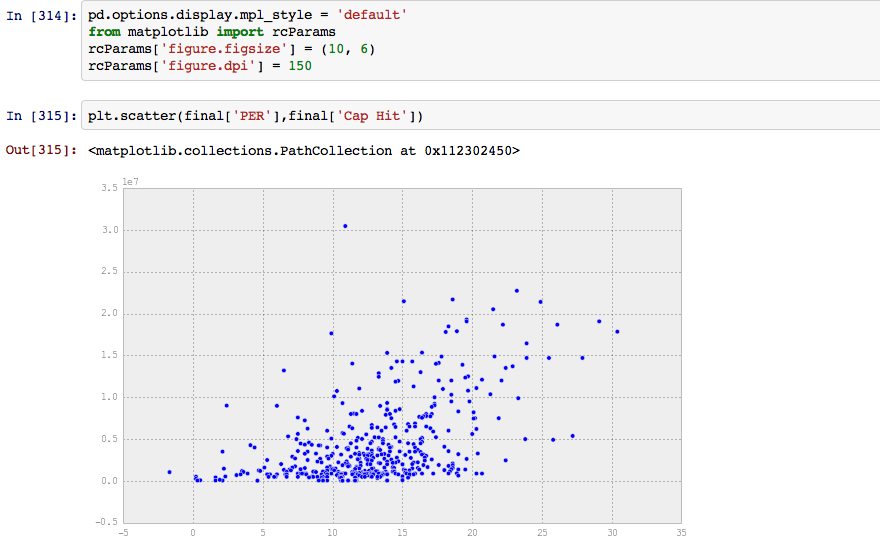
Now that we have all of the data cleaned and in the proper format we can begin plotting it and working on making predictions. Below I have created a scatter plot of the PER and Salary data.
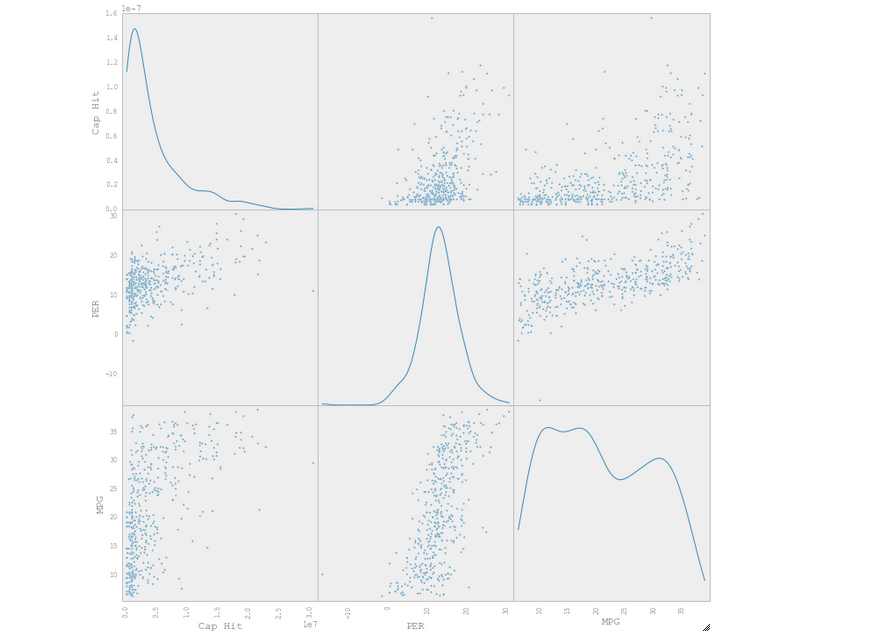
To further visualize the data I created a scatter plot matrix of the Salary, PER, and MPG.

Time to make some predictions on the data, the first step in this process was creating a model with the NBA data. I went with a simple Linear Regression classifier as we are looking to predict a continious target variable.
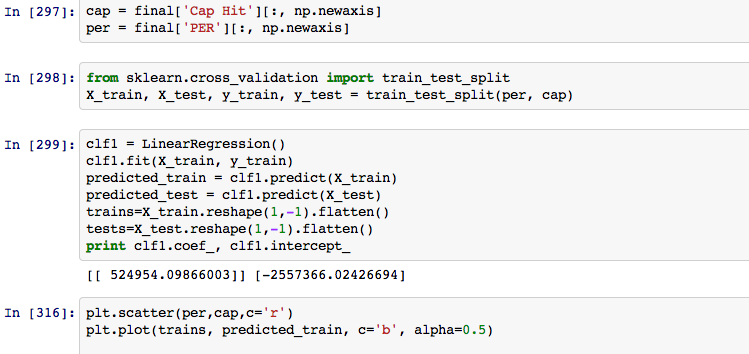
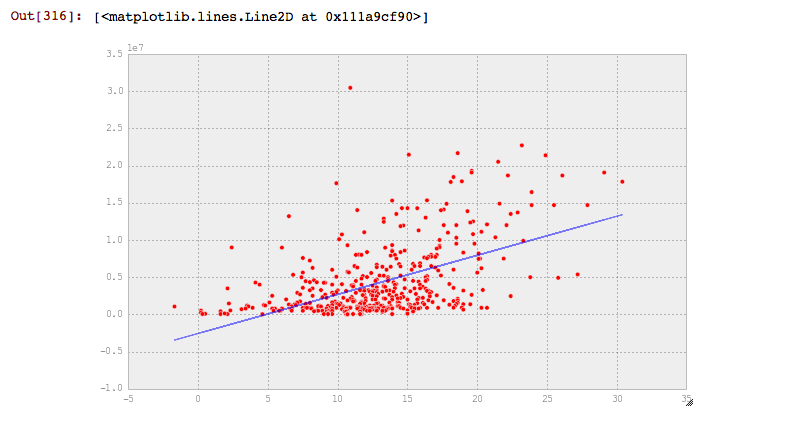
Testing the classifier on a random PER.

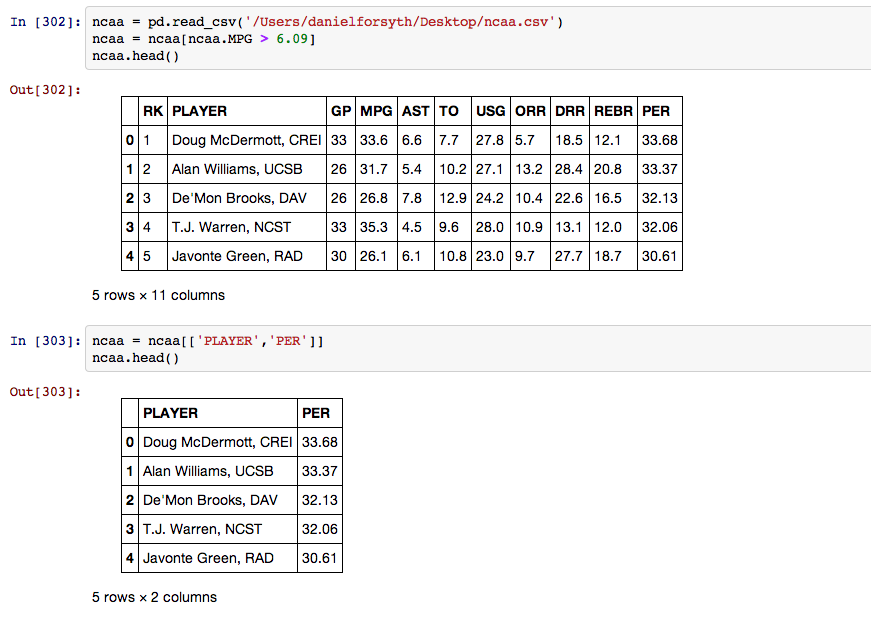
At this point it was time to show the model some data from NCAA players. I was able to scrape the PER ratings of the top 100 NCAA players from this current season off of ESPN.com. The following code displays this data.
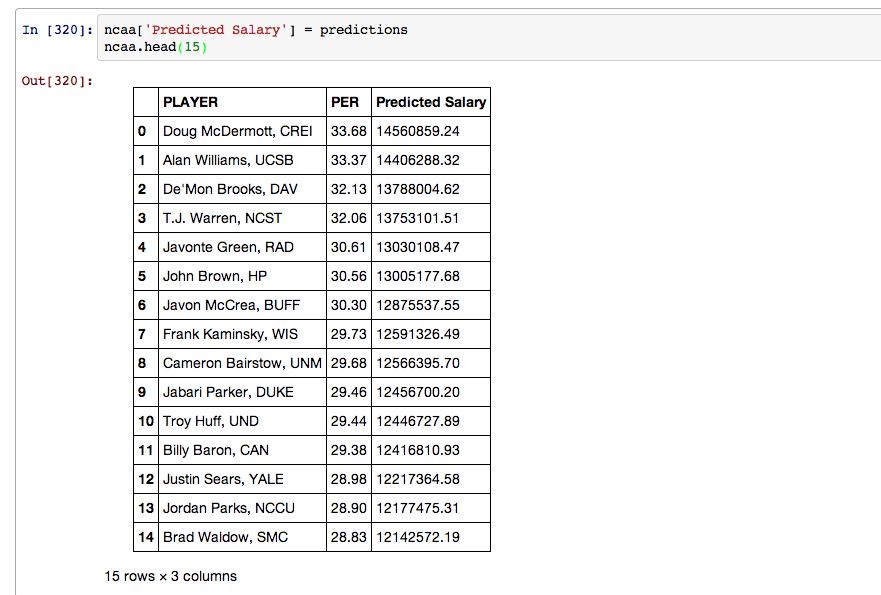
I then created a list of predicted salary based on the players PER rating and then added it into the data frame.

The dataframe below shows the top 15 players based on PER and their predicted salary.
In the future it would be interesting to apply this approach to previous seasons data and then compare the predicted salary to the actual salary of players that were drafted into the NBA. I would also be curious to see how players with very high player efficeny ratings in college fared when they made the move to the pros, especially those playing in less competitive conferences.
The complete notebook is available here and all of the code is on my github. As always I would appreciate any feedback, advice, or corrections. You can find me on Twitter or email me at danforsyth1@gmail.com.
