
2019 StockX Data Contest Entry
Ever since I was a kid I have loved sneakers and been interested in the impact they have on everything from sports to popular culture. So a few months ago when I saw that StockX was holding a data contest I was very excited to participate. If you are not familiar with StockX they label themselves as 'The Stock Market of Things' and feature a live ‘bid/ask’ marketplace for sneakers, clothes, bags, and watches. They are mostly known for their sneakers and have emerged as one of the premier players in the secondary sneaker market among competitors such as GOAT, Grailed, and Stadium Goods.
The data given for the contest consisted of:
A random sample of all Off-White x Nike and Yeezy 350 sales from between 9/1/2017 (the month that Off-White first debuted “The Ten” collection) and the present. There are 99,956 total sales in the data set; 27,794 Off-White sales, and 72,162 Yeezy sales. The sample consists of U.S. sales only. To create this sample, we took a random, fixed percentage of StockX sales (X%) for each colorway, on each day, since September 2017. So, for each day the Off-White Jordan 1 was on the market, we randomly selected X% of its sale from each day. (It’s not important to know what X is; all that matters is that it’s a random sample, and that the same fixed X% of sales was selected from every day, for every sneaker). We’ve included 8 variables for you to work with: Order Date, Brand, Sneaker Name, Sale Price ($), Retail Price ($), Release Date, Shoe Size, and Buyer State (the U.S. state the buyer shipped to).
with the entry rules being wide open:
We give you a bunch of original StockX sneaker data, then you crunch the numbers and come up with the coolest, smartest, most compelling story you can tell. It can be literally anything you want. A theory, an insight, even just a really original data visualization. It could be a novel hypothesis about resale prices you’ve always wanted to test. Or maybe it’s just a beautiful chart to visualize the data. It can be on any subject – sneakers, brands, buyers, or even StockX itself. Whatever you find interesting, just follow your bliss.
When trying to think of interesting ideas for a submission I recalled a class I had taken a few years ago called "Machine Learning for Trading" and thought it would be the perfect fit to combine some techniques I learned in the class to the data contest, it is StockX afterall.
When analyzing securities (stocks, bonds, derivatives, sneakers) there are two primary methods used. The first is fundamental analysis where you are attempting to determine the intrinsic value of the company by looking at key numbers and economic indicators from things like financial statements and industry conditions. The second is technical analysis where you attempt to forecast the direction of prices by looking at historical data. I wanted to apply technical analysis to sneaker data for my entry.
I used a tool from technical analysis called Bollinger Bands to develop optimal buy and sell signals for a particular sneaker, in this case the Jordan 1 Retro High Off-White Chicago. A new take on Michael Jordan's first signature shoe and one of the most sought after sneakers in the past few years (Currently selling for $3650 in my size on StockX).
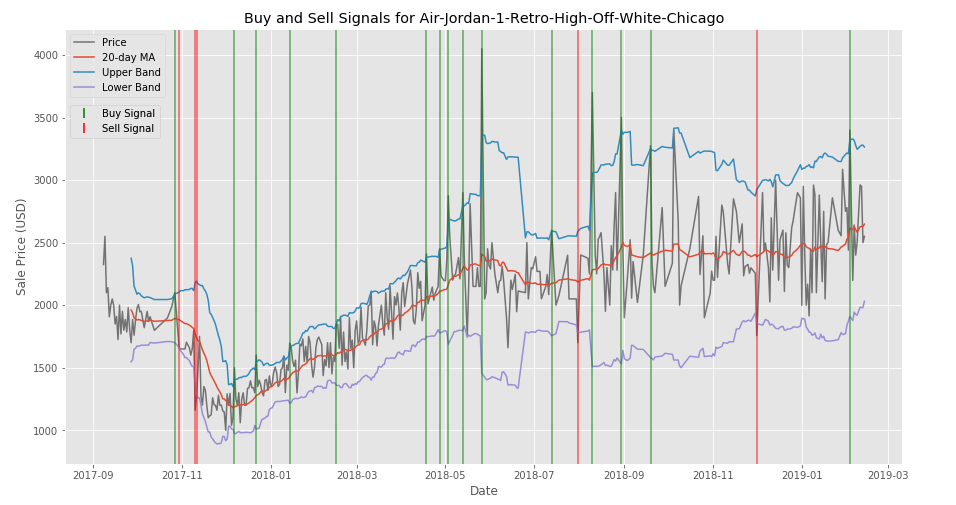
Bollinger Bands are a form of technical analysis used to evaluate price action and volatility of a stock. To create Bollinger Bands you first plot the 20-day moving average of the stock price. Next you create two “Bands” that are two standard deviations above and below the moving average respectively. These bands are measures of volatility, when the movement of the price is volatile the bands will expand, and when the price becomes less volatile they contract. When the price crosses down, from outside the upper Band, to inside towards the moving average we use this as a trigger to sell. Conversely, when the price crosses up through the bottom Band towards the moving average this signals a buy. Bollinger Bands are effective because when the price exits either of the Bands that means it is outside 2 standard deviations of the moving average. Therefore we would expect that the price will eventually return back in the direction of the moving average. This method attempts to follow the classic mantra “buy low and sell high” but using Bollinger Bands instead of intuition.
Below are my plotted Bollinger Bands for the Jordan 1 Retro High Off-White Chicago sales data. You can see early on the price dropped pretty steadily and there are several sell signals. Then as time goes on and the price slowly rises the buy signals begin to come in. Around August 2018 the prices start to become more volatile, the sales less frequent, and the bands widen which probably signals the number of sneakers available is beginning to dry up which will slowly drive the price even higher.
I think something like this would be a cool feature to implement as a 'Good Time to Buy' banner on a particular sneakers sale page - here is the page for the Jordan 1.
I did not win the contest but I had a lot of fun exploring the dataset and look forward to next years. There were a ton of excellent submissions - you can see the winners here.