
Analyzing a NHL Playoff Game With Twitter
Since its inception eight years ago Jack Dorsey's Twitter has grown into one of the most popular websites on the internet. With over a billion registered users and an average of five hundred million tweets sent per day Twitter is creating incredible amounts of data. Many novel ideas have come out of the question of what to do with all of this data, from predicting stocks to more recently predicting crime.
When I was first learning python one of the first libraries I came across was Tweepy, an open source, easy to use python library for accessing the Twitter API. There are three different ways to get access to Twitters enormous amounts of data. First is Twitters search API which allows you to gather tweets which were made in the past. You can collect tweets based on user, keywords, locations, its basically the same as when you are searching for tweets on Twitters website except you are limited to how much you can collect. Twitters streaming API allows you to compile tweets as they are happening in real time. You can use the same type parameters as you can with the search API looking for tweets based on keywords or even geographic locations. The disadvantage of the streaming API is that you are not collecting all of the Tweets that are being sent in real time only a sample of ~1% of the current traffic. The only way to get the full stream of all tweets being sent that match your criteria is the Twitter Firehose. The only way to get access to the Firehose is to go through a third party such as Datasift or the recently acquired by twitter, GNIP.
Early on when I was experimenting with Tweepy I began thinking of interesting projects that could come out of all this data I had the the potential of collecting. One idea that always stuck was the thought of collecting tweets during sports games and seeing what could be done with the resulting data. Being a Philadelphia Flyers fan I chose to use Twitters streaming API to collect tweets sent during their last playoff game against the New York Rangers (SPOILER ALERT: they lost).

The following code takes all tweets with the keyword 'flyers' and sends the time it was created, text of the tweet, location (if available), and the source of the tweet to a local MongoDB database. I have removed my consumer and secret keys, you can obtain your own by creating an app on twitters dev site.
import tweepy
import sys
import pymongo
consumer_key=""
consumer_secret=""
access_token=""
access_token_secret=""
auth = tweepy.OAuthHandler(consumer_key, consumer_secret)
auth.set_access_token(access_token, access_token_secret)
api = tweepy.API(auth)
class CustomStreamListener(tweepy.StreamListener):
def __init__(self, api):
self.api = api
super(tweepy.StreamListener, self).__init__()
self.db = pymongo.MongoClient().Flyers
def on_status(self, status):
print status.text , "\n"
data ={}
data['text'] = status.text
data['created_at'] = status.created_at
data['geo'] = status.geo
data['source'] = status.source
self.db.Tweets.insert(data)
def on_error(self, status_code):
print >> sys.stderr, 'Encountered error with status code:', status_code
return True # Don't kill the stream
def on_timeout(self):
print >> sys.stderr, 'Timeout...'
return True # Don't kill the stream
sapi = tweepy.streaming.Stream(auth, CustomStreamListener(api))
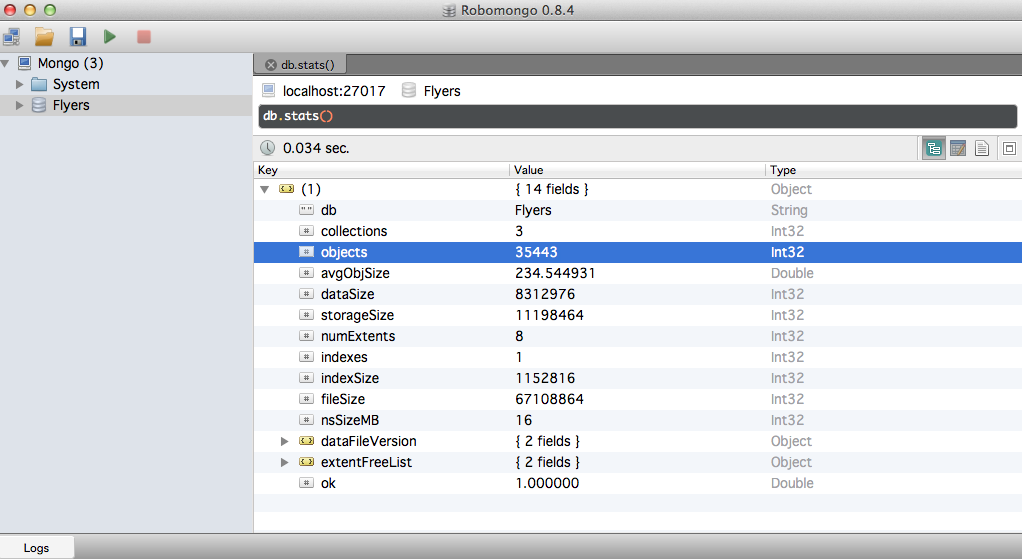
sapi.filter(track=['flyers'])Once you run the script you will see the tweets appear on the terminal window and the MongoDB begin to fill. I use the Robomongo GUI to keep track of this. I ran the script fifteen minutes prior to the beginning of the game and ended it fifteen minutes after for the sake of consistency. By the end I had collected 35,443 tweets. For a little bit of context I was collecting around 7,000 tweets for regular season Flyers games and was able to gather 640,000 during the Super Bowl.
Once I had all of the data collected I exported a CSV of everything and began looking at it in iPython. The code below creates a pandas dataframe from the CSV file, makes the created_at column into the index and then converts it to a pandas time series. I also converted the time to EST 12 hour format for graph readability.
import pandas as pd
from pandas.tseries.resample import TimeGrouper
from pandas.tseries.offsets import DateOffset
flyers = pd.read_csv('/Users/danielforsyth/Desktop/PHI_NYR_G3.csv')
flyers['created_at'] = pd.to_datetime(pd.Series(flyers['created_at']))
flyers.set_index('created_at', drop=False, inplace=True)
flyers.index = flyers.index.tz_localize('GMT').tz_convert('EST')
flyers.index = flyers.index - DateOffset(hours = 12)
flyers.index

Next I took a quick look at everything using the head and desrcibe methods built into pandas.
flyers.head()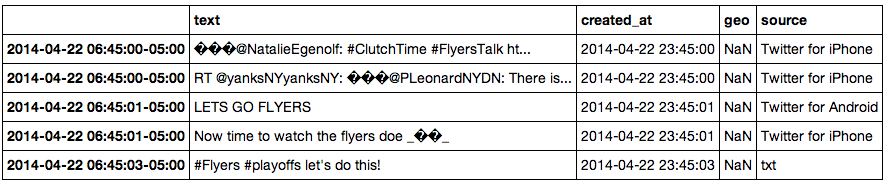
flyers.describe()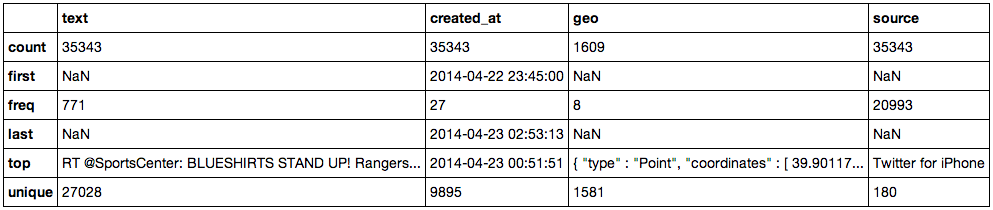
Now it was time to get the data ready to graph. One quick line and the created_at timeseries is in a per minute minute format.
flyers1m = flyers['created_at'].resample('1t', how='count')
flyers1m.head()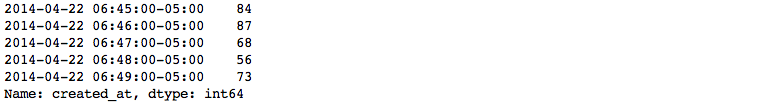
You can also quickly find the average amount of tweets per minute. Which in this case was 187.
avg = flyers1m.mean()Now that I had all of the data formatted properly I imported Vincent and created a graph.
import vincent
vincent.core.initialize_notebook()
area = vincent.Area(flyers1m)
area.colors(brew='Spectral')
area.display()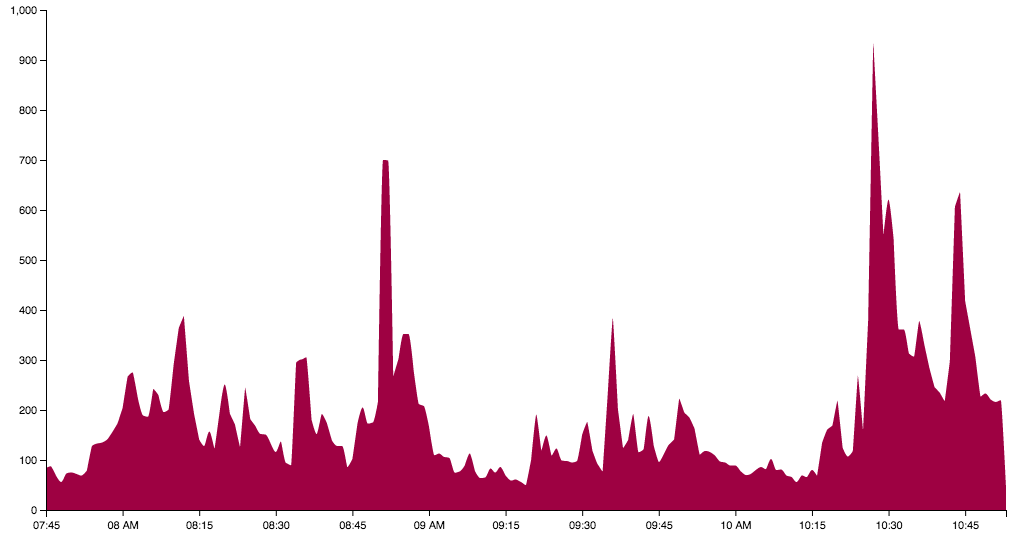
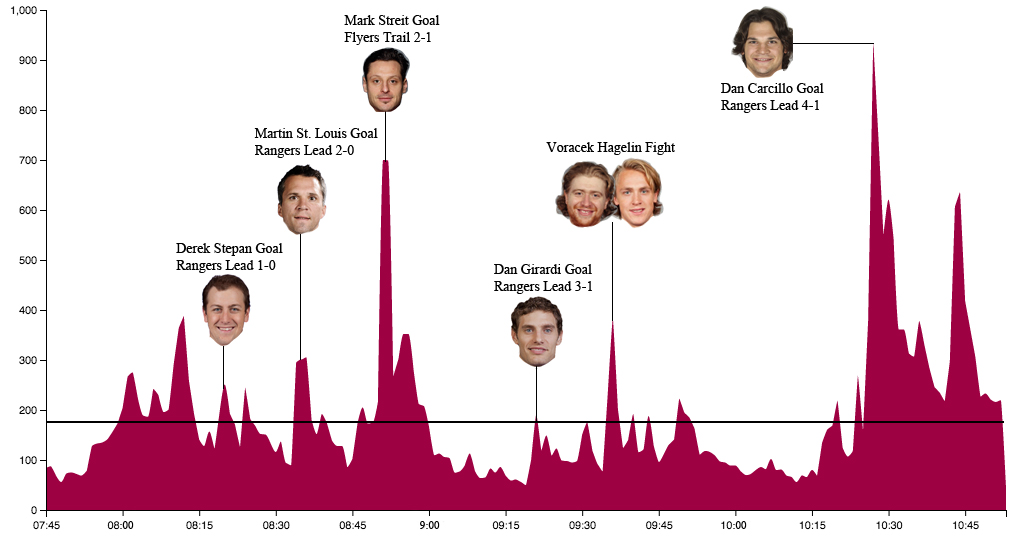
As you can see because the search term used here was 'flyers' the results are very biased towards them. The two highest peaks in tweet volume are during the first Flyers goal (700 tweets per minute) and the final Rangers goal by ex-Flyer Dan Carcillo (938 tweets per minute), who doesn't have an exceptionally great reputation. There are also two large peaks at the beginning and end of the game.
After I had graphed all of the data I turned to looking at the actual tweets themself. For this process I used NLTK which is a natural language processing library for python. The first steps were to import NLTK, create a list of all the text from the tweets and then create a new list after filtering out all of the stop words (high frequency words that are irrelevant i.e. to, the, also).
import nltk
from nltk.corpus import stopwords
from nltk import FreqDist
stop = stopwords.words('english')
text = flyers['text']
tokens = []
for txt in text.values:
tokens.extend([t.lower().strip(":,.") for t in txt.split()])
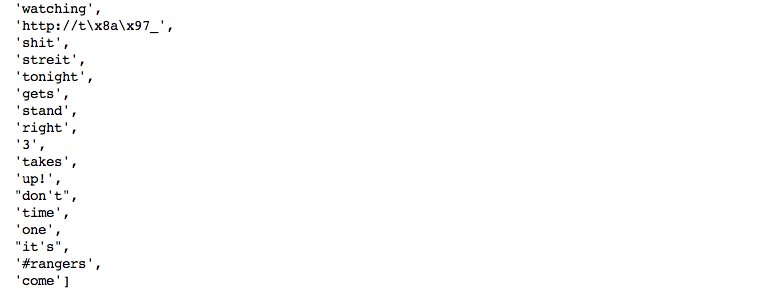
filtered_tokens = [w for w in tokens if not w in stop]After we have a list of filtered words we are able to look at the frequency ditribution of the words. Below are the 50 most used words and a frequency plot of the 25 most used words.
freq_dist = nltk.FreqDist(filtered_tokens)

freq_dist
freq_dist.keys()[:50]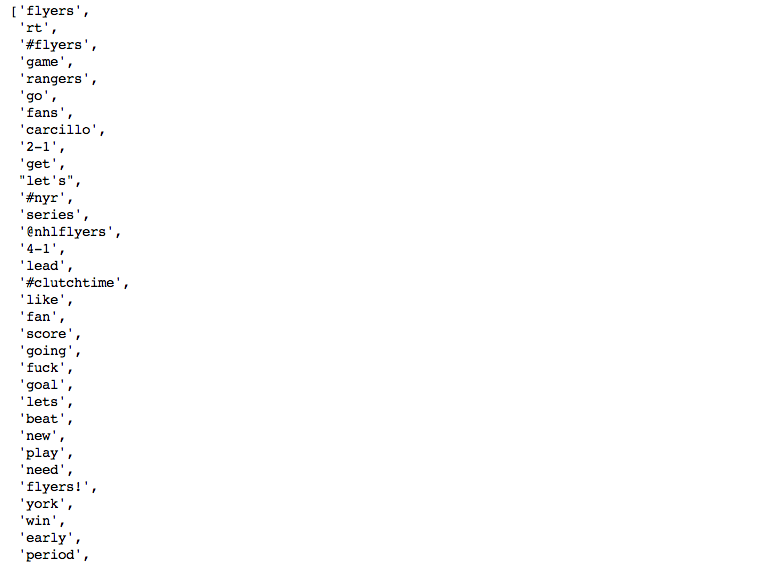
freq_dist.plot(25)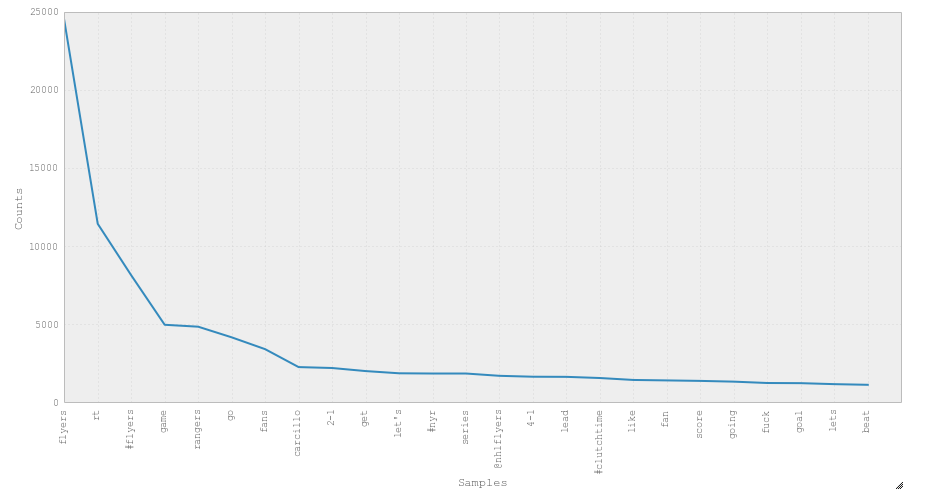
Next I took a look at the source data that was collected with each tweet. Below are the top fifteen sources, as you can see iPhone users dominate the sample with four times as many tweets as both android and web users.
flyers.source.value_counts()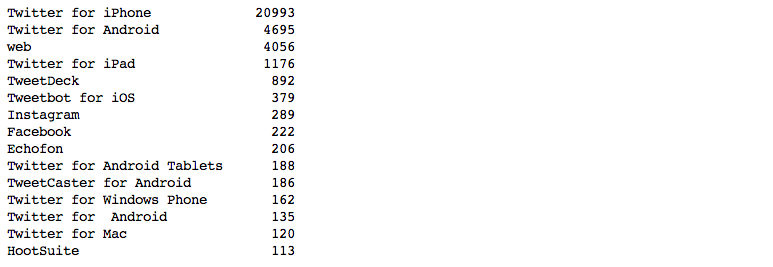
The last piece of data I had to look at was the location. Since having location data attatched with your tweets is optional not every tweet includes this information. Out of the 35,443 tweets I had collected only 1,609 had location data. Below is a map of all the tweets I created using Folium
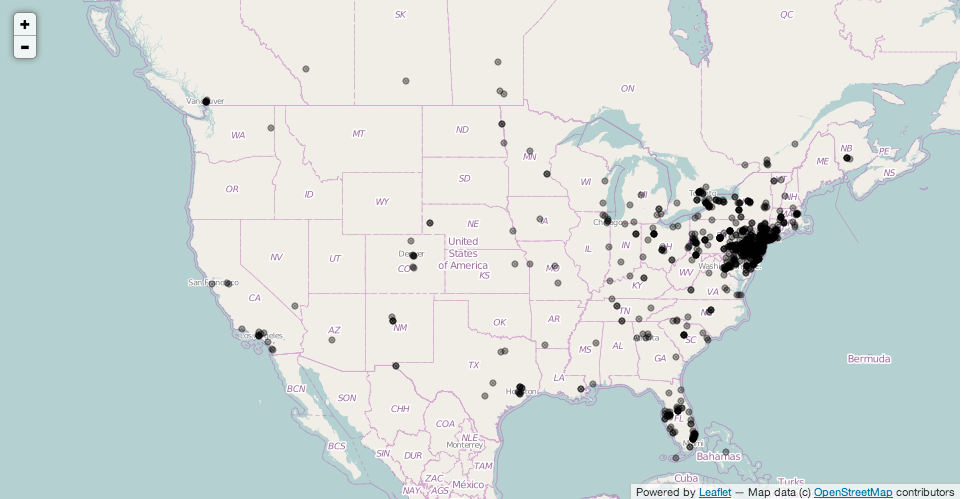
You can see almost all of the tweets are concentrated in the Philadelphia area but there are also some areas in both Florida and California with some pretty heavy tweeting.
In the future I would like to try putting scripts on EC2 instances and pushing all of the tweets to something like Heroku to automate the process and keep from having everything local. I would also like to try searching for the opposing team simultaneously to see how the results differ from one another. Implementing some D3 visualizations is also somthing I would like to try as well as building a real time web application to watch the data come in as the game is being played.
This was a very interesting project with some pretty cool results especially considering I was only using around one percent of all the tweets being sent during the game. If you have any questions, feedback, advice, or corrections please get in touch with me on Twitter or email me at danforsyth1@gmail.com.