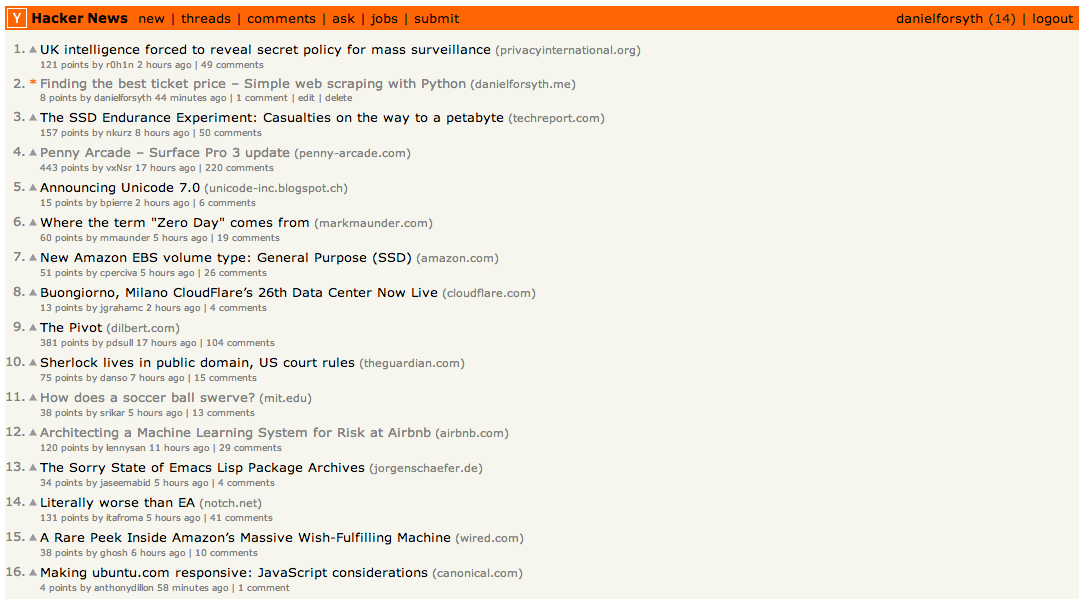
Breakfast under Bill - A look at my morning on the front page of Hacker News
Tuesday night I wrote a short blog post about how I used python to find cheap tickets to a music festival. I finished up pretty late so I decided to post it online the next morning. I woke up pretty early and posted the article on a few websites around seven. I started watching my google analytics page and the hits started coming in very fast, much faster than normal. First it was twenty, then thirty, and shortly after fifty people were reading within minutes of submitting. I looked at the map and most of the hits were from Europe. I must have lunch hour crowd. I navigated over to Hacker News planning to check the new section and see if I had gotten any upvotes and to my surprise I saw my article at number five on the front page. I couldn't believe my eyes and refreshed and it had already moved up a spot. At its peak it hit the number two spot, I couldn't believe short article on something pretty trivial had made the front page. It spent most of the morning fluctuating around the fifth spot, a good portion of the time under Bill Gates blog post on developing genetically modified bananas.

By the end of the day my blog dashboard said I had hit fourteen thousand hits. However google analytics had a somewhat smaller number. I am not sure what caused this difference but I decided to export the data and take a look at what had happened throughout the day. The first thing I took a look at was views throughout the day.
import pandas as pd
import matplotlib.pyplot as plt
%matplotlib inline

views = pd.read_csv('/Users/danielforsyth/Desktop/views_tues.csv')
views['hour'] = pd.to_datetime(pd.Series(views['hour']))
views.set_index('hour', drop=False, inplace=True)

pd.options.display.mpl_style = 'default'
from matplotlib import rcParams
rcParams['figure.figsize'] = (18, 6)
rcParams['figure.dpi'] = 150

views.plot(colormap = 'Spectral')As you can see the views increase dramatically early on and then after peaking around two thousand at nine slowly drop as the post moved further down the page. To get an idea of how much traffic I recieved compared to normal I created a graph of all traffic since I created my blog.
total = pd.read_csv('/Users/danielforsyth/Desktop/views_all.csv')
total['Day'] = pd.to_datetime(pd.Series(total['Day']))
total.set_index('Day', drop=False, inplace=True)
total.plot()The spikes occur on the days I had posted articles. The most views I had gotten in a single day previously was two thousand, the same number I got within an hour while on the front page. Lastly I took a quick look at where people were viewing from and what browser they were using.
There were views from one hundred and fourteen countries. I listed a few of them below with a bar chart of the top ten, I did the same for browsers.
countries = pd.read_csv('/Users/danielforsyth/Desktop/countries.csv')
countries.set_index('Country', drop=False, inplace=True)top10 = countries.head(10)
top10.plot(kind='bar', rot=90)browser = pd.read_csv('/Users/danielforsyth/Desktop/browsers.csv')
browser.set_index('Browser', drop=False, inplace=True)btop10 = browser.head(10)
btop10.plot(kind='bar', rot=90)As you can see making the front page of HN provided an insane amount of traffic. I believe I mostly got lucky by posting at the right time but I recieved a lot of great feedback and messages which provided great motivation to keep working on cool things. If you have any questions, feedback, advice, or corrections please get in touch with me on Twitter or email me at danforsyth1@gmail.com.
