
Exploring NBA Data with Python
After a long weekend of NBA All-Star game festivities I stumbled upon Greg Reda's excellent blog post about web scraping on Twitter. In it he goes over how to find and use API's to scrape data from webpages. The example he uses is the NBA's very own stats website, which to my surprise provides a lot of very interesting data. I decided to dig a little deeper and see what I could find.

The shot log API from NBA.com returns data about every shot a player took during a game. These data points include how much time was left in the game when the shot was taken, time on the shot clock when the shot was taken, dribbles taken before the shot, and even the closest defender when the shot was taken. The information I found the most interesting and focused on collecting were the distance the shot was taken from, the distance of the closest defender, the number of dribbles taken before the shot was taken, and the amount of time the player possessed the ball before shooting. The API takes a player ID and returns all of the data for each shot in every game this season unless specified otherwise. So my first step was creating a dictionary of all the players I wanted to collect data on. I chose to use every player who has played in at least seventy percent of his team's games as this is the minimum the NBA uses to qualify players as a scoring leader [1]. Below is an example of the Washington Wizard's dictionary with the player name as the key and the players id as the value, I wont show every team for the sake of space.
teams ={'wizards':{
                   'garrett temple':'202066',
                   'andre miller':'1889',
                   'kevin seraphin':'202338',
                   'otto porter':'203490',
                   'rasual butler':'2446',
                   'kris humphries':'2743',
                   'nene hilario':'2403',
                   'paul pierce':'1718',
                   'marcin gortat':'101162',
                   'bradley beal':'203078',
                   'john wall':'202322'
                   }
After having all of the player ID's ready I wrote a function to take each players ID, get the data from the API, find the players averages for the year and then add all of this into a dictionary for each players.
import requests
import json
import pandas as pd

players = []
player_stats = {'name':None,'avg_dribbles':None,'avg_touch_time':None,'avg_shot_distance':None,'avg_defender_distance':None}

def find_stats(name,player_id):
    #NBA Stats API using selected player ID
    url = 'http://stats.nba.com/stats/playerdashptshotlog?'+ \
    'DateFrom=&DateTo=&GameSegment=&LastNGames=0&LeagueID=00&' + \
    'Location=&Month=0&OpponentTeamID=0&Outcome=&Period=0&' + \
    'PlayerID='+player_id+'&Season=2014-15&SeasonSegment=&' + \
    'SeasonType=Regular+Season&TeamID=0&VsConference=&VsDivision='

    #Create Dict based on JSON response
    response = requests.get(url)
    shots = response.json()['resultSets'][0]['rowSet']
    data = json.loads(response.text)

    #Create df from data and find averages
    headers = data['resultSets'][0]['headers']
    shot_data = data['resultSets'][0]['rowSet']
    df = pd.DataFrame(shot_data,columns=headers)
    avg_def = df['CLOSE_DEF_DIST'].mean(axis=1)
    avg_dribbles = df['DRIBBLES'].mean(axis=1)
    avg_shot_distance = df['SHOT_DIST'].mean(axis=1)
    avg_touch_time = df['TOUCH_TIME'].mean(axis=1)

    #add Averages to dictionary then to list
    player_stats['name'] = name
    player_stats['avg_defender_distance']=avg_def
    player_stats['avg_shot_distance'] = avg_shot_distance
    player_stats['avg_touch_time'] = avg_touch_time
    player_stats['avg_dribbles'] = avg_dribbles
    players.append(player_stats.copy())
The next step was getting all of the data. I did this by iterating over every player in the teams dictionary and calling the find_stats function.
for x in teams:
    for y in teams[x]:
        find_stats(y,teams[x][y])
Now that I had all of the data in place I created a pandas dataframe to make sorting through everything much easier.
cols = ['name','avg_defender_distance','avg_dribbles','avg_shot_distance','avg_touch_time']
df = pd.DataFrame(players,columns = cols)
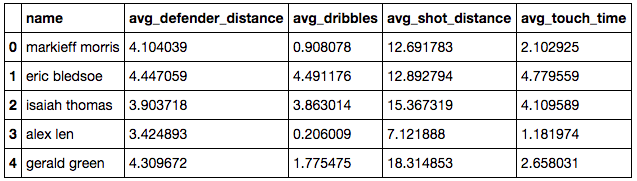
Sanity Check
df.head()
With everything in place it was time to start answering some questions with the data. The first thing I was interested in finding was which player had the largest average defender distance when they shot.
defender_distance = df[['name','avg_defender_distance']]
defender_distance.sort('avg_defender_distance',ascending=False)
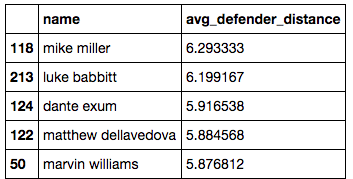
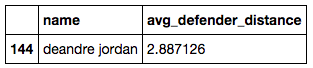
As you can see Mike Miller of the Cavaliers has the highest average distance of just over six feet. Defenders are basically daring Miller to take open shots, which makes sense given his .33 field goal percentage which is less than half that of league leader DeAndre Jordan who's .725 field goal percentage has defenders guarding him from an average of just under three feet away.
defender_distance.loc[df['name'] == 'deandre jordan']
The next question I was interested in answering was which player is shooting from distance the most?
shot_distance = df[['name','avg_shot_distance']]
shot_distance.sort('avg_shot_distance',ascending=False)
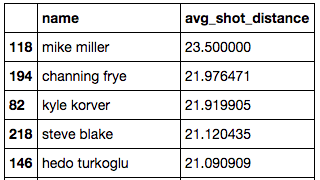
Mike Miller is back again with an average shot distance of twenty three and a half feet, which makes his average shot a three-pointer.
The last question I was interested in answering was who was holding the ball the longest before they shot? I used the average dribbles before the shot and average possession time before the shot for this.
dribbles = df[['name','avg_dribbles']]
dribbles.sort('avg_dribbles',ascending=False)
avg_time = df[['name','avg_touch_time']]
avg_time.sort('avg_touch_time',ascending=False)
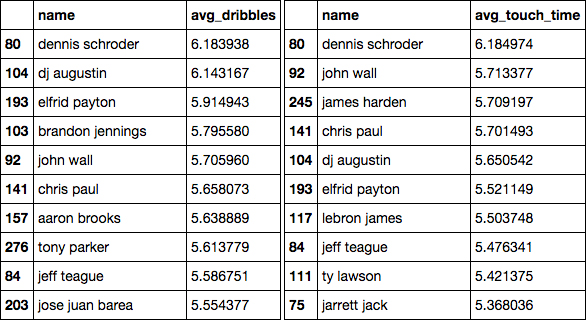
As you can see average dribbles before shot and time of possession before shot are very closely correlated, with each dribble taking about one second. Almost all of the players on both lists are also point guards which makes sense because they're going to have the ball in their hand the most out of anyone on the court.
Looking at all of this data has been very interesting and there is still a lot left to explore. Some other things I would like to look into are which players are taking the big shots, shots taken with only a few seconds left on the play clock, and also take a look at these types of data points on a team level.
If you have any questions, feedback, advice, or corrections please get in touch with me on Twitter or email me at danforsyth1@gmail.com.