
Pandas & Burritos - Analyzing Chipotle Order Data

A few months back the New York Times ran an article titled "At Chipotle, How Many Calories Do People Really Eat?" which took a look at the average amount of calories a typical order at Chipotle contained. They found that:
The typical order at Chipotle has about 1,070 calories. That’s more than half of the calories that most adults are supposed to eat in an entire day. The recommended range for most adults is between 1,600 and 2,400.
Very surprising, Chipotle isn't the healthiest place to eat. What was more interesting to me was the fact that the NYT released the data they used for the article on their Github page. The article states that "The data is based on about 3,000 meals in about 1,800 Grubhub orders from July to December 2012, almost all from two Chipotle restaurants: one in Washington, D.C., and another in East Lansing, Mich."
I had been meaning to mess around with this order file for a while but had forgotten about it. That was until today when today I saw Chipotle had announced it will be offering delivery in select cities through a SF based delivery startup.
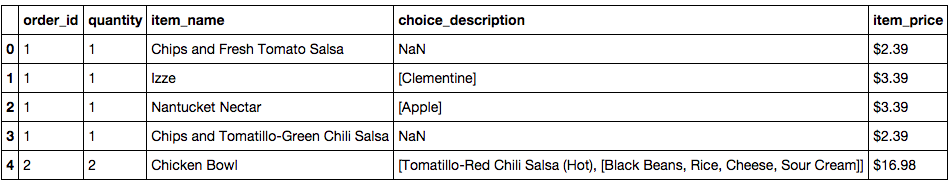
After starting up a new IPython notebook I loaded the TSV file into a pandas dataframe and ran the .head() method to make sure everything looked okay.
import pandas as pd
df = pd.read_table('/Users/danielforsyth/Desktop/orders.tsv')
df.head()
The First thing I wanted to look at was what items were the most popular.
items = df.item_name.value_counts().plot(kind='bar')
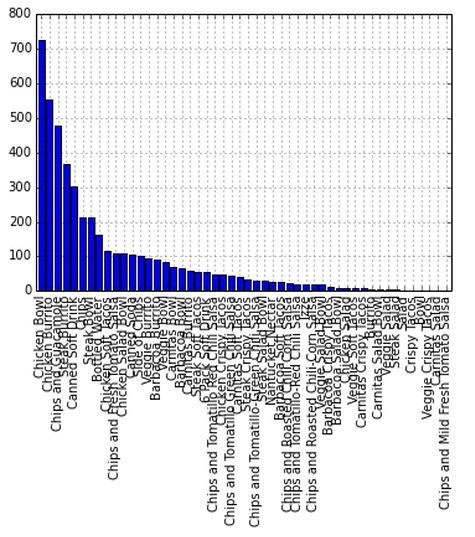
You can see that the chicken bowl dominates all of the items but there's obviously way too much going on here. How about just the top ten most popular items.
items = df.item_name.value_counts()[:10].plot(kind='bar')
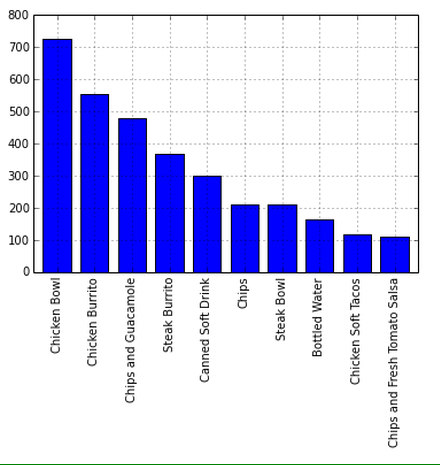
That's much easier to read and you can clearly see the chicken bowl and chicken burrito are the most popular items at the locations included in the data.
Next I wanted to look at the prices of the orders. This was a little trickier as the 'item price' column contained string values and multiple items could be part of one order. The first step was to strip the $ sign from the string and then convert it to a float. Then you can just group by the order_id and add the sum method on the end.
df['item_price'] = df['item_price'].str.replace('$','')
df['item_price'] = df['item_price'].astype(float)

orders = df.groupby('order_id').sum()
orders.head()
orders['item_price'].describe()
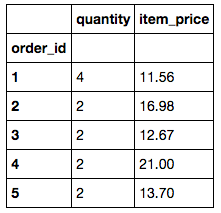
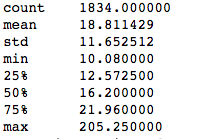
From this we are able to see that 1834 meals were ordered with a total of 4622 different items. The mean price of a meal is $18 with the minimum being right around $10 (Obligatory mention of the term fast casual). Someone was also able to rack up a $205 dollar bill.
The last type of information I was interested in finding was the variety of different meals people ordered. The 'choice description' column describes the item type. For example what kind of soda or what toppings on a burrito bowl.
descriptions = df.groupby(["item_name", "choice_description"])["order_id"].count().reset_index(name="count")
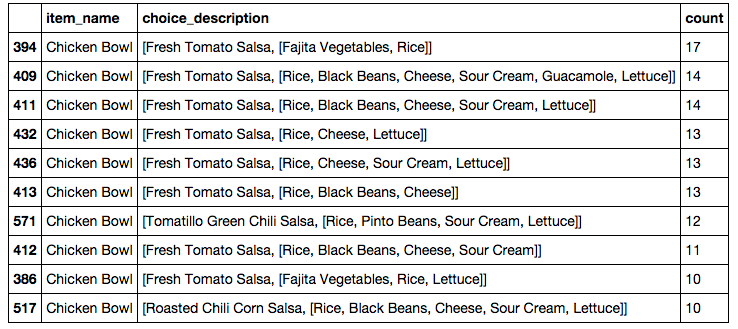
Using this new dataframe we can easily see the most popular versions of each menu item. For example the different kinds of the most ordered item, the chicken bowl.
descriptions = descriptions[descriptions['item_name'].str.contains("Chicken Bowl")]
descriptions.sort(['count'], ascending=False)[:10]
There were actually 348 different varieties of chicken bowls ordered but I limited it to the top ten which you can see here.
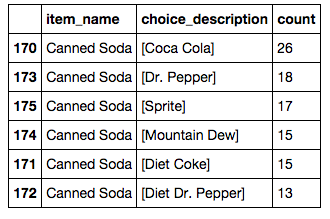
How about the most popular drinks?
descriptions = descriptions[descriptions['item_name'].str.contains("Canned Soda")]
descriptions.sort(['count'], ascending=False)
It was very interesting playing around with this dataset, I would be curious to see the results if something like this were to be done at a much larger scale, to see things such as ordering trends in different stores and areas of the country. I am sure this data is very useful to Chipotle to see what items are doing well on top of optimizing inventory control on a location to location basis.
If you have any questions, feedback, advice, or corrections please get in touch with me on Twitter or email me at danforsyth1@gmail.com.